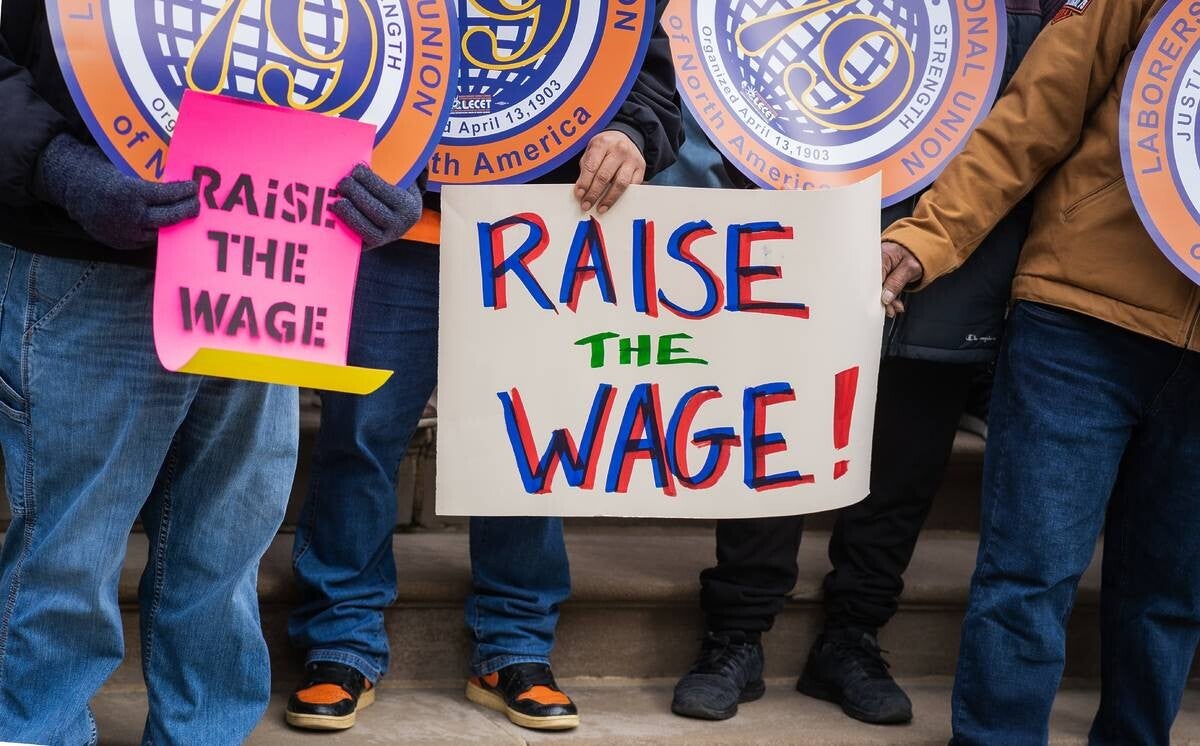
The federal minimum wage is only one part of the larger picture of low wages and poverty in the United States. This page looks at who earns at or below the federal minimum wage, how many workers earn wages above that level but are still relatively low-paid, how poverty compares with the minimum-wage population, and how wages differ across cities.
The Bigger Picture Behind the Minimum Wage
The federal minimum wage is $7.25 per hour, but that number does not tell the whole story about low-wage work or poverty. In 2024, about 80.3 million workers in the United States were paid hourly, and 843,000 of them earned at or below the federal minimum wage. This was about 1.0% of all hourly workers. Looking beyond this smaller group helps show how many workers earn wages above the federal minimum but may still be earning relatively low wages.
Who Earns at or Below the Federal Minimum Wage?
In 2024, 843,000 hourly workers earned at or below the federal minimum wage. Of these workers, 82,000 earned exactly $7.25 and 760,000 were below $7.25. Workers under 25 made up 43.1% of the group, while workers 25 and older made up 56.9%. Women represented 61.7% and men represented 38.3%. Part-time workers also made up a larger share than full-time workers. Service occupations accounted for 72.6% of workers at or below the federal minimum wage, while food preparation and serving occupations accounted for 58.0%.
WHO EARNS AT OR BELOW $7.25?
| Category | |
|---|---|
| Under 25 | 43.1% |
| 25 and older | 56.9% |
| Women | 61.7% |
| Men | 38.3% |
| Part-Time | 55.9% |
| Full-Time | 43.5% |
Source: U.S. Bureau of Labor Statistics, Characteristics of Minimum Wage Workers, 2024.
The Broader Low-Wage Workforce
The federal minimum wage only identifies one part of the lower end of the wage distribution. BLS data for May 2025 show a 10th-percentile hourly wage of $15.00, a 25th-percentile wage of $18.07, and a median wage of $24.51. Using the 80.348 million hourly workers reported in 2024 as a rough base gives estimates of how many workers fall below these percentile points. These calculations are estimates, not direct BLS counts of workers earning exactly those wages.
Calculations: Estimated, not direct BLS headcounts
Blog posts & articles
| Wage level | Estimated workers |
|---|---|
| $7.25 or below | 843,000 |
| $15.00 | 8.0 million |
| $18.07 | 20.1 million |
| $24.51 | 40.2 million |
80.348 million × 10% = 8.035 million
80.348 million × 25% = 20.087 million
80.348 million × 50% = 40.174 million
35.9 million ÷ 843,000 = 42.6
Approximately 43 people in official poverty for every one hourly worker earning at or below $7.25.
| Wage | Estimated workers |
|---|---|
| $7.25 | 0.843 million |
| $15.00 | 8.035 million |
| $18.07 | 20.087 million |
| $24.51 | 40.174 million |
POVERTY
CITY COMPARISON
The number of people living in poverty is much larger than the number of hourly workers earning at or below the federal minimum wage. The Census Bureau reported that 35.9 million people were in official poverty in 2024, which was an official poverty rate of 10.6%. Comparing 35.9 million people in poverty with 843,000 hourly workers at or below the federal minimum gives about 42.6 people in poverty for every one worker in the minimum-wage group. This is a comparison between two different populations, so it does not mean that everyone in poverty earns the minimum wage. Instead, it shows that poverty is much broader than the group identified by the federal minimum-wage statistic.
What Would $20 an Hour Mean in Different Cities?
A wage does not have the same purchasing power everywhere. For example, earning $20 per hour for 40 hours a week for 52 weeks would equal $41,600 per year before taxes. The city comparison shows the hourly wage needed to have purchasing power equivalent to $20 in Rochester. This illustrates how differences in living costs can change what a particular wage means for a worker.
$20 × 40 hours × 52 weeks = $41,600 per year
Source: Bankrate cost-of-living comparison used for the assignment.
| City | Equivalent hourly wage |
|---|---|
| Rochester, NY | $20.00 |
| New York/Manhattan, NY | $46.37 |
| Boston, MA | $29.54 |
| Los Angeles-Long Beach, CA | $30.11 |
| Chicago, IL | $23.48 |
| Miami-Dade County, FL | $23.94 |
| Dallas, TX | $19.55 |
| Atlanta, GA | $18.46 |
| Seattle, WA | $28.82 |
| Denver, CO | $21.66 |
| Houston, TX | $18.50 |
What About a $17 Minimum Wage?
A $17 federal minimum wage would be a substantial increase from the current federal minimum wage of $7.25. Looking at the broader wage distribution and differences in living costs shows why the effects of a minimum wage cannot be understood from the federal minimum alone. Workers have different wages, jobs, and living expenses, and employers may respond differently depending on their labor market. The research discussed below provides evidence about some possible effects of minimum wages, but it does not establish one identical outcome for every worker or location.
NBER RESEARCH
Neumark and Wohl examine whether minimum wages help workers in poor and low-income families. Using data from the Survey of Income and Program Participation, they study employment, hours, and earnings among low-wage workers. They report adverse rather than beneficial effects on these outcomes for initially employed low-wage workers in poor and low-income families. They also report that the effects do not become progressively worse for the poorest workers. The authors argue that these findings help explain why minimum wages do not reduce poverty.
Source: Neumark, David, and Emma Wohl, NBER Working Paper 35628, 2026.
Bils, Kaymak, and Wu, 2025
Bils, Kaymak, and Wu examine minimum wages through the idea of monopsony power, where employers have some power in setting wages. Their research uses Brazilian administrative data to study wage differences within firms and between firms. Their calibrated model predicts that minimum wages can increase wages and formal employment for more productive workers while pushing less productive workers out of formal employment. Because the model is calibrated to Brazilian data, its results should not automatically be treated as a direct estimate of what would happen under a U.S. minimum wage.
Source: Bils, Mark, Bariş Kaymak, and Kai-Jie Wu, NBER Working Paper 34165, 2025.
CONCLUSION
The evidence shows that the federal minimum-wage group is relatively small compared with the entire hourly workforce, while the broader group of workers earning lower wages is much larger. It also shows that poverty includes many more people than the minimum-wage population and that the purchasing power of a wage can differ between cities. The two NBER papers provide additional evidence about possible employment and wage effects of minimum wages. At the same time, these statistics do not show that every low-wage worker is poor or that every person in poverty earns a low wage. The percentile calculations are estimates, and the research studies have specific data and methods. Together, the evidence provides a broader way to look at minimum wages, low-wage work, poverty, and cost of living.
SOURCES
- U.S. Bureau of Labor Statistics. Characteristics of Minimum Wage Workers, 2024. BLS source
- U.S. Bureau of Labor Statistics. Occupational Employment and Wage Statistics, May 2025. BLS OEWS
- U.S. Census Bureau. Poverty in the United States: 2024. Census report
- Neumark, David, and Emma Wohl. Do Minimum Wages Help Workers in Poor and Low-Income Families? NBER Working Paper 35628, 2026. NBER Working Paper 35628
- Bils, Mark, Bariş Kaymak, and Kai-Jie Wu. Robinson Meets Roy: Monopsony Power and Comparative Advantage. NBER Working Paper 34165, 2025. NBER Working Paper 34165
Create Your Own Website With Webador